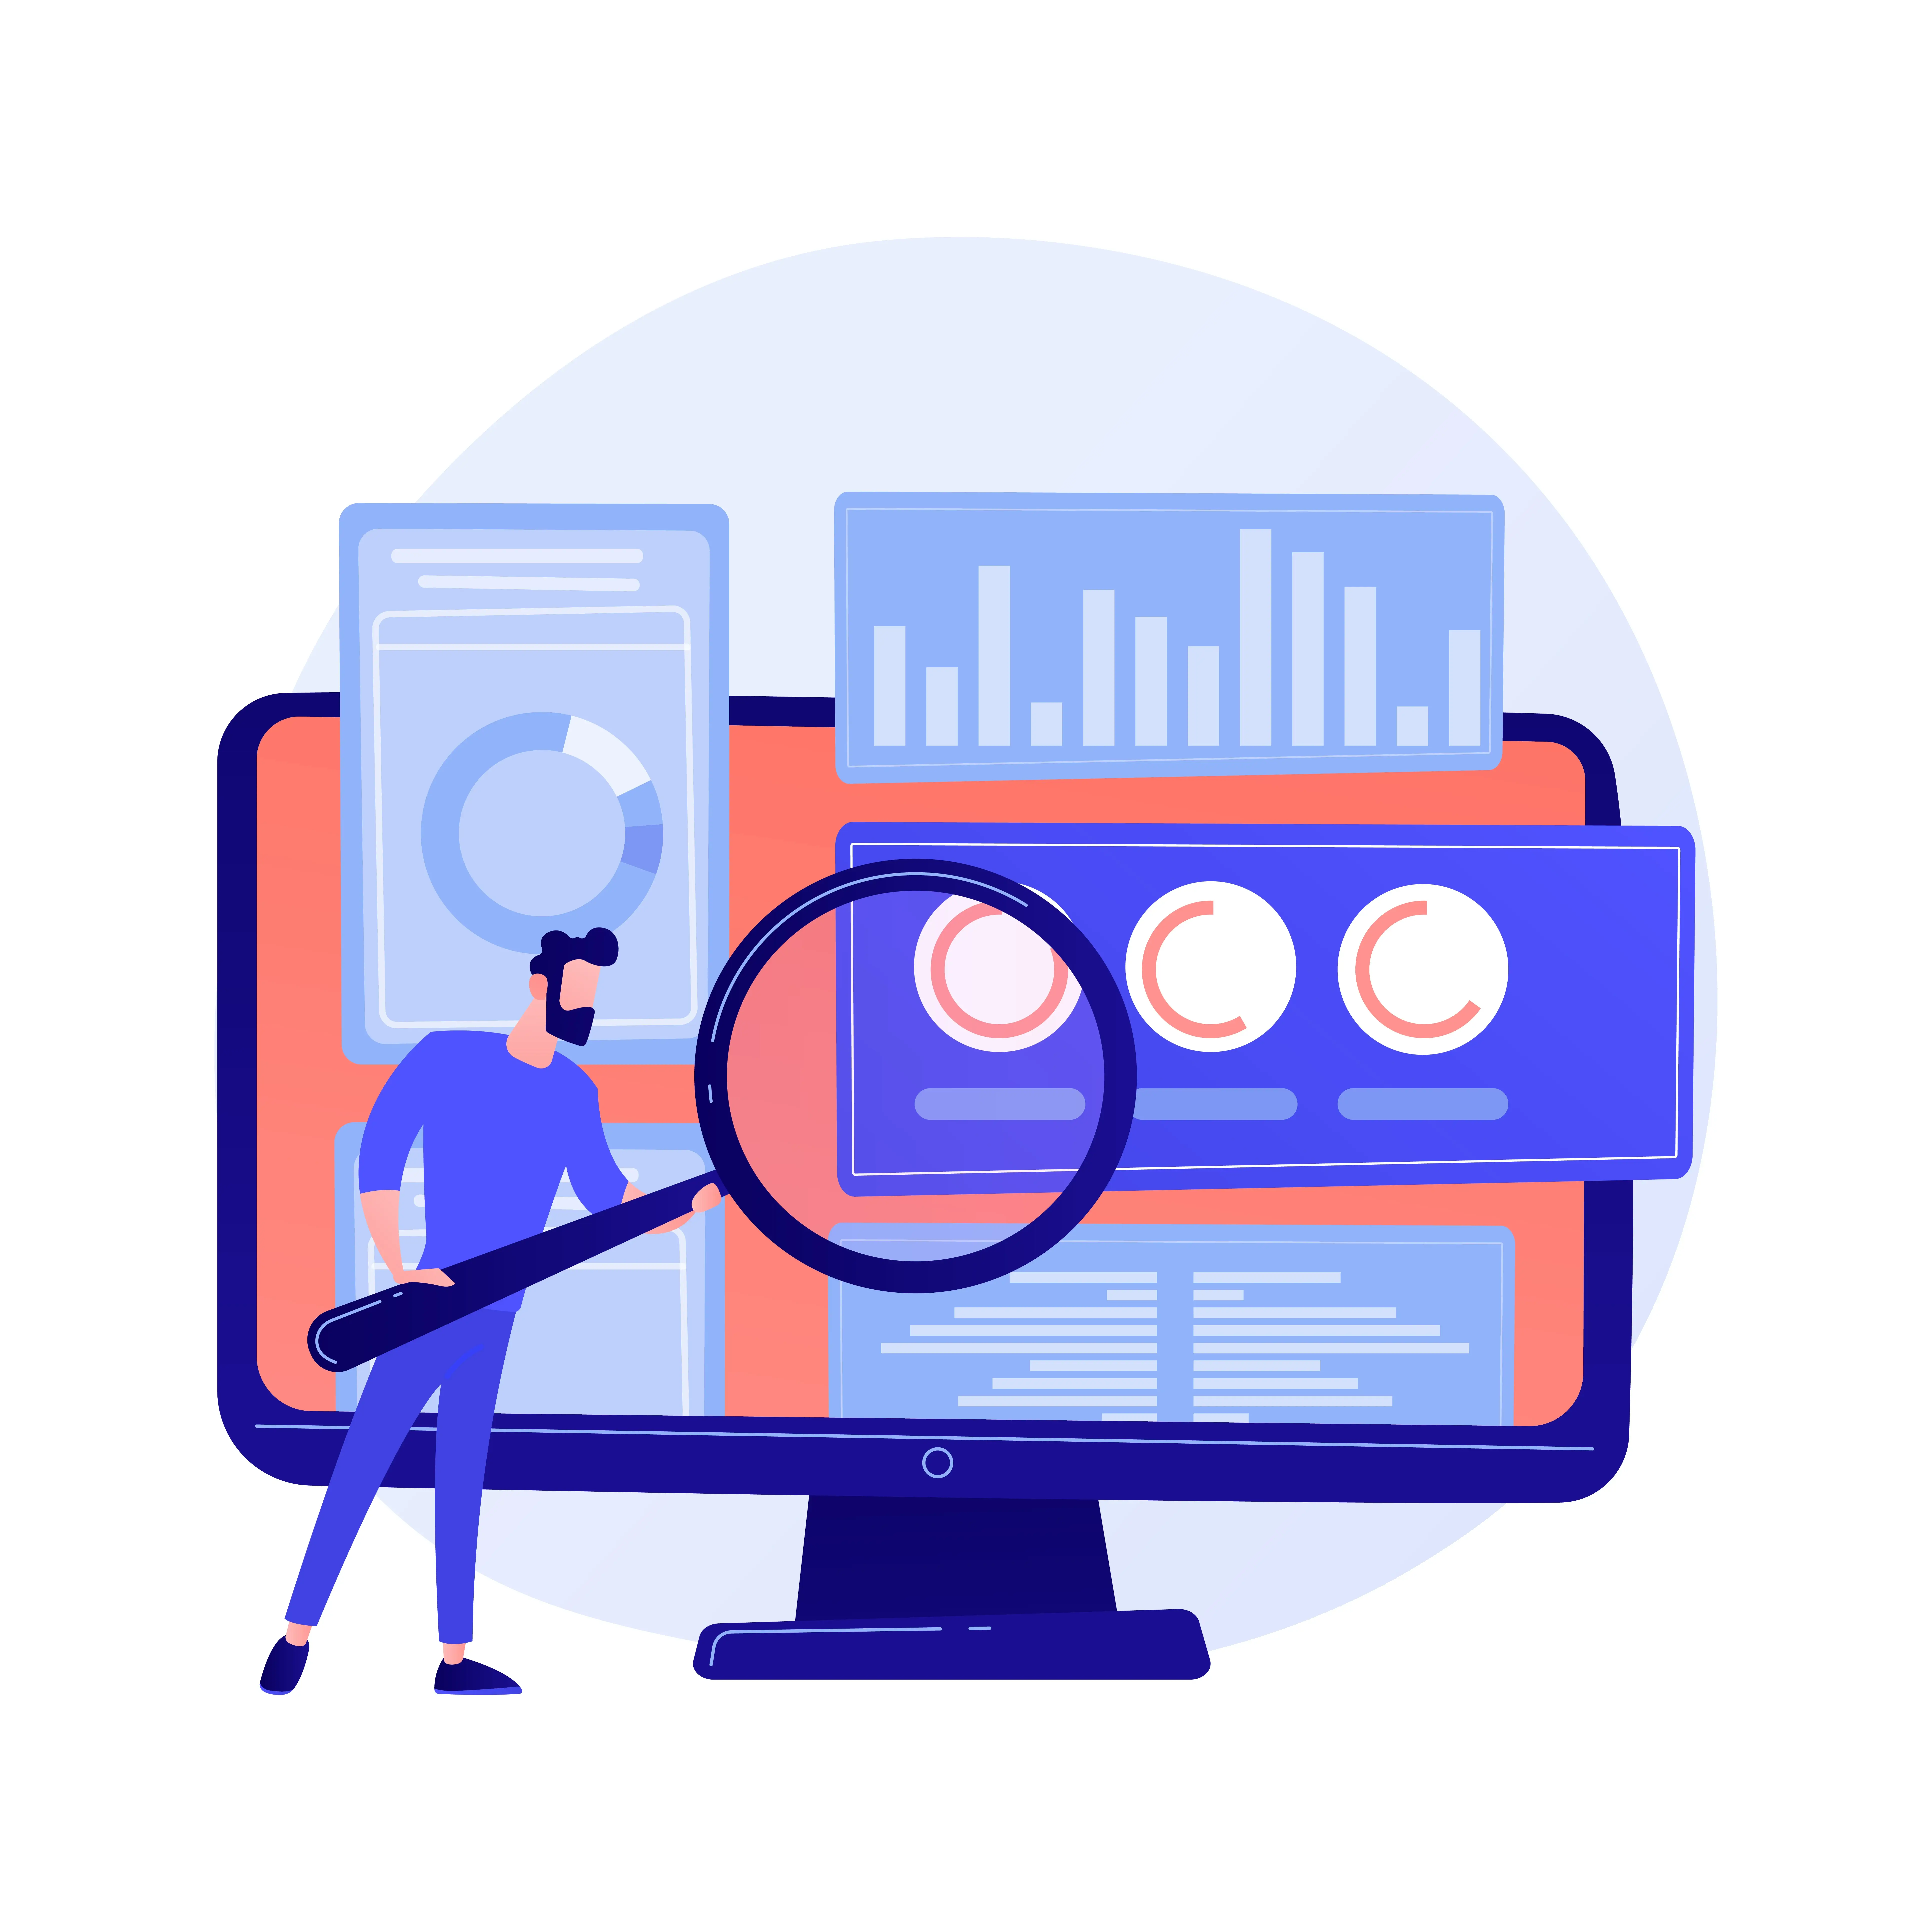
- Observability: Observability is the ability to understand the internal state of a system by interpreting its external outputs. This encompasses metrics, logs, traces, and other data to provide a holistic view of system behavior. Observability is crucial for identifying issues and troubleshooting in complex, distributed systems.
- Monitoring: Monitoring involves the collection, storage, and analysis of data from various sources within an application or infrastructure. It helps organizations ensure that their systems are performing as expected, detect anomalies, and respond to issues promptly.
When observability and monitoring are used in tandem, product teams can better support issue handling and take a preemptive approach to it. One of the most popular providers for observability and monitoring is AWS. For now, we’ll ignore AWS and examine the top 5 observability and monitoring tools of 2023.
1. Prometheus Observability and Monitoring
Prometheus is an open-source monitoring and alerting toolkit widely used in cloud-native environments. It collects time-series data through a pull-based model, supports multi-dimensional data, and offers powerful query and alerting capabilities using PromQL.
- Key Features: Service discovery, scraping, alerting, extensive exporters, and support for Grafana integration.
- When to Use: Ideal for monitoring microservices, containers, and cloud-native applications.
2. Grafana Observability and Monitoring
Grafana is an open-source platform for visualizing and analyzing metrics from various data sources, including Prometheus, InfluxDB, and Elasticsearch. It provides a rich set of visualization options and dashboards for real-time monitoring.
- Key Features: Extensive data source support, alerting, plugins, dashboard templates, and user-friendly UI.
- When to Use: Used for creating dashboards and visualizing data from different monitoring tools.
3. Datadog Observability and Monitoring
Datadog is a cloud-based observability platform that combines metrics, traces, and logs in one unified solution. It provides real-time insights into the performance of applications and infrastructure, making it easier to detect and troubleshoot issues.
- Key Features: AIOps, machine learning-based anomaly detection, integrations with various services and platforms, and customizable dashboards.
- When to Use: Suitable for organizations with cloud-native applications and a need for comprehensive observability.
4. New Relic Observability and Monitoring
New Relic is a performance monitoring and observability platform that offers end-to-end visibility into applications and infrastructure. It provides detailed insights into application performance, user experience, and business impact.
- Key Features: Real-time monitoring, application performance monitoring (APM), error tracking, distributed tracing, and serverless monitoring.
- When to Use: Valuable for monitoring web and mobile applications, containerized workloads, and cloud services.
5. Splunk Observability and Monitoring
Splunk is a data analytics and monitoring platform that enables organizations to search, analyze, and visualize machine data. It offers a wide range of solutions, including security, IT operations, and application performance monitoring.
- Key Features: Log management, real-time data analysis, machine learning, and customizable dashboards.
- When to Use: Suited for organizations with complex, data-intensive monitoring and analysis needs.
The Bottom Line / TLDR
The right observability and monitoring tools depend on your application’s and infrastructure’s specific requirements, budget, and complexity. You may need just one or all parts of a proposed observability and monitoring tool. Reach out to Uplancer for a free consultation to understand what you actually need and to get you the right observability and monitoring solutions built for your architecture or if you have other cloud service needs.